NEED FOR TOUCH AND TWO-WAY COMMUNICATION IN E-COMMERCE
Hassan Jawed
Saad Alam
Abstract
The average consumer feels the need to physically touch their desired product before they pursue an online purchase. This ability lags online and the result is in preference for traditional buying over e-commerce. The new variable we had identified to this research was introduction of new technology that could be 3D-4D graphics which literally brings the product lifelike in front of them. Autotelic and Instrumental (NFT) Need for Touch Are Independent variables, whereas (PEOU) Perceived Ease of Use, (PE) Perceived Enjoyment and (PU) Perceived Usefulness are moderators that lead to our dependent variable (Loy) Loyalty. The further variable we added was ‘New Technology’ to aid perception and Loyalty. We gathered data though questionnaires and online surveys by targeting male and female between 13-40 years’ old who were familiar with e-commerce. We worked on SPSS, AMOS, MS Word and Excel to support our research. Our research benefits all those who faced trouble during shopping online, those who were not satisfied enough by viewing pictures or reading reviews but needed a more realistic approach. Future research possibility may be adding exceptional technology that enables viewer popup images on screen of PC or mobile. Future research can be conducted to bring holistic e-commerce. It may contain mediators that further inflate loyalty.
Keywords: Consumer convenience, e-commerce, online marketing, omni-channel, two-way communication, integrated marketing channel.
Introduction
Overview and Background
Online sellers have the added advantage over traditional retailers to be available around the clock with minimum physical requirement. (Adelaar, 2004).Consumer convenience has swiftly increased enhanced technology that enabled shopping from desired brand. Rangaswamy, 2005). It has largely deduced the decade (Enright, 2015).The traditional marketing tactics adopted by retailers is seldom found catchy and intriguing by customers. Social sites have modified engagement between brands and shoppers through the fifth marketing ‘P’ participation considered in marketing (Tuten). While engaging online; the customer has evolved itself to analyze three points which aid their advantage: “Business correspondence” reveals their intention to attract before selling, “proficient opinions” that reveal non biased fair enlighten on products and customer reviews which do not lie unlike businesses and are based on honest transaction. These key points have augmented importance for businesses to observe formal and informal communication within and outside the firm to successfully indulge in e- commerce (Jianjun, David, & Qiang, 2017).
Portion of sale underlying e-commerce out of total sales comprises of just 7.3% and growing, but is not likely to trounce traditional sales anywhere near in the future (DeNale, 2016). There is no denying reality that customers are turning to online markets in ascending figures, 90% sales is captured by traditional channels out of which 85% have revealed their preference to shop offline (Time, 2015). As a result of changing the emerging e-commerce, need is derived to continuously tap into integrating communication channels to trigger the customer’s cycle (Neslin & Scott, 2009). The consumer’s choice of social channel has expanded requirement for integration (Bell, 2015). To contrast this emergence minor but quality researches have brewed discussion on interfusing several channels in on all in one ‘Omni-channel’ commute that gives customer liberty to browse their preference closely. The approach to Omni-channel eradicated limited approach and is a result of holistic all integrated marketing (Hansen, 2015).
Problem Statement:
Online commerce has grown largely since 2004 solely due consuming minimum physical capacity and the super natural ability to serve 24/7. A study conducted in 2016 concluded the massive window for online retailers as more than 200 million people were frequent online customer but this huge amount totals only 7.3% of total sales of the market. The authors in our base article tried to discuss the need for touch and how consumers would prefer physical markets rather than the virtual ones, this fact is conversed and researched on by many researchers including businesses who want to do their business online. Now according to these researches around 55% and in some researches there are 85% of the consumers who would like to actually touch the product while browsing online. In other words, for businesses who are dealing their customers online around 55% to 85% of market which is uncapped or revenue not yet earned. But this is the time for technology, and we can’t even imagine what technology will be used in the future?
Identified variable:
In this case shortfall of consumers and their need of touch can be overcome via technology. We all know that technology is going to play a huge part in our lives especially 3D and 4D tools in the future, so why can’t we use that technology and give that same physical experience to the consumers. We can easily use the new upcoming technology for e.g. 3D printing and visuals to give the consumers the same physical product experience.
The need for touch and two-way communication research paper emphasis on introducing a technique that allows touch stimuli for consumers because according to them people were found much satisfied with feeling texture before buying. Another prospect states increased need of two-way communication to abridge product details and eradicate misinformation between both parties. However, what this paper does not write-in and the additional variable we identified is introduction of integrated marketing communication. There are many technological products which are under development and will be available for use in the future we will discuss many of them and the effect it will have on the consumers need for touch and two-way communication in e-commerce as our research in the article also suggested. Model with added variable (New technology).
The customer looks around for various pools of information they can collect from here and there about their desired product. They will look on social sites and read reviews before they make a purchase. They will look for new technology for information and views; through Omni-channel they can seek various integrated platforms for convenience and ease of use (Juaneda, Emma, Ana , & Yolanda, 2016). Feeling the product is essential to help assess its actual texture (Yazdanparast, Spears, & N, 2013). The inability to be aware of the products presence can and has left numerous consumers in doubt and have turned away to never return. This slit began innovative thought to bring product life like (Peck, 2003a). These gaps have long forced companies and managers to think different methods to enable touch ability of online sale (Yazdanparast, Spears, & N, 2013).
Objectives and Significance of study:
To touch the product is the most basic of all senses in human beings. This ability allows the customer to make better judgments about the good and understand about the product’s quality. Need for touch influences the final decision of the buyer when they are able to fondle the good physically. Touch ability is common in traditional market stores that possess psychical presence, but it is impossible while shopping online. This paper examines the multiple channels associated along customer’s perception when they are allowed to interact with a product online. Goods with higher need for touch criteria are more preferred to be bought by physical means as they are perceived for being more reliable p. The average consumer is less likely to fall for descriptions over the net about product, but this can be reduced if introduced haptic for Perceived ease of use, perceived usefulness and perceived enjoyment. The channels are diverse ranging from multi-channel communication to introducing new means in technology. Sole purpose is to ease consumers in e-commerce and aid to them with perceived ease for their usage, perceived usefulness and enjoyment. The significance of this study is:
· Determining the importance of need for touch in e-commerce.
· Role of Autotelic and instrumental need for touch in loyalty.
· Why perception has such significance to a customer in online shopping.
· How perceived ease of use aids loyal customers.
· Moderating affect that perceived enjoyment has over loyalty.
· To which extent are consumers willing to adapt new technology.
Outline of study:
Audience targeted for conducting this research were those who had engaged themselves in an online shopping experience recently (not more than 2-3 years in the past preferably). Demographics we targeted were people who fell in the age bracket of 13 – 50 years of age. Reason for choosing this age bracket was the idea to collect data from various intellectual capabilities, as younger people (13-35 years) were found more patient if they were to use new technology and portrayed enthusiasm. On the other hand, people (35-50 years) aged people were optimistic for new technology because of perceived usefulness and were glad upon perceived use of ease. All of the people did conclude they pretty much enjoyed the innovative approach by mediating new technology in e-commerce and would likely remain loyal to those brands who adopted such method. The research was conducted in densely populated areas of Karachi; our aim was covering maximum grounds so we received plenty of diverse data which supported our research. Consumers had displeasure because of sites that displayed falsely enhanced images and delivered the exact opposite; they decided to choose traditional markets than online ones since they did not lack the sense of touch there. Also there are numerous companies Karachi that sell online products but are biased depending on location they provided service in.
Literature Review
Definition and explanation:
Autotelic Need for Touch:
An intrinsic urge to Need for Touch is what the regular consumer feels when they are about to purchase anything. They need to feel the texture to determine quality and examine the product extensively (Peck & Childers, 2003) With no intention of purchase but just to observe the need for touch is unspoken but obvious (Peck & WigginS, 2006)To touch is the most basic of senses in human beings, the need for touch will bring attachment and desire to purchase. This assists consumer buying behavior (Peck & SHU, 2009)
I
nstrumental Need for Touch:
Instrumental need for touch is diverting attention to the materialistic feel of the product. It covers the product’s texture and feel, size and weight, shape and geometrical element. Instrumental NFT gives then real sense of quality and earns self-assurance; this will help them when making purchasing decision(Klatzky, Lederman, & Matula, 1993). Consumers have shown different behavior while choosing a product and while buying it. They try to find out features to relate it to something what they have perceived, then they would like to read information provided and contrast it with other similar goods (Payne, JR, & Jhonsan, 1993).
Perceived Ease of Use:
Ease of use is one of the most vital elements for online customers (Davis, 1989). PEOU Is the belief that using a particular measure will bring them ease that was previously not an option for them (Radner & Rothschild, 1975). When the consumer has this perception created, they will be much satisfied with received association and relay more on the brand therefore bring loyalty (Hamid, Abdul razzak, Azlina, & Adbullah)whereas PEOU is more critical to a new user(Geffin & Straub, 2000).
Perceived Usefulness:
Perceived usefulness is known as the belief by what measure will an enhancement bring in their routine. The measure would favor them positively so they can use it to their advantage (Pfeffer, 1982).E-commerce has shown a larger platform for businesses because the virtual world has unlocked many possibilities; this decreased the gap between companies and consumers as this reduction in effort has been proven very useful(Drew, 2003).The internet is the vast scope of consumers; but as they grow older their social activities shrink ultimately whatever the companies try to do but the aged consumer’s perceived usefulness will face a smooth decline (Hertzog & HultscH, 2000).
Perceived Enjoyment:
Attitude and behavior toward the commodity are setting the path for e-commerce (Ajzen & Fishbien, 1980). The willingness for buying is the determinant of good or bad impression the consumer has, it is the attitude which alters buying behavior(Ajzen & Fishbien, 1980). The decree of user satisfaction is necessary fora healthy online environment also known as E-satisfaction (D & Hise, 2000).
New Technology:
Modern market has taken the change to allure customers from traditional marketing means to an online community. This change is subject to evolving market completion and service expansion. This makes the company expand its reach and opt for newer ways to engage. Taking advantage of technological revolution businesses are moving toward this initiative (Stoica & Brote, 2012). The marketing environment is prone to fast changing technology as investment means and customer brands relationships are being evaluated on the basis of IT (Stoica & Brote, 2012).
Loyalty:
Providing what the customer wants is the decree of satisfaction the company can leverage. This is not only to attain loyalty but is also the requirement of constant evolving market and its challenger’s posed threats. Delivering customer requirement enables customer retention which leads to loyal consumers (Parasuraman, Zeithaml, & Berry). Research has verified that company’s steadiness is determined by the total of loyal customers it possesses(McDougall & Levesque, 2000). Loyal customers maintain and promote the brand by constructive feedback and encouraging word of mouth (Reichheld, Sasser, & EARL, 1990).
Relationships:
Autotelic NFT vs. Loyalty:
The role of Autotelic NFT with connection to Loyalty is potentially high as company and customer is at a geographical distance (Papadopoulou & Andreou, 2001).Numerous options have been discussed over time regard with online presence of company and its role in retaining the customer(Reichheld, Sasser, & EARL, 1990). Laying a hand on the product certainly rises satisfaction level for the consumer; the pleased customer is more likely to remain (Caruana, 2002)
Autotelic NFT vs. Perceived Ease of Use:
Senses of humans make them gather information from their surroundings. In e-commerce consumers have to make decision upon Autotelic instinct p. Need for touch is imperative in marketing online p. Online retailers have the need to develop some alternate for not being able to touch because it decreases perceived ease of use p. Lacking ease of use is the most significant reason why consumers do not prompt for online buying p.
Autotelic NFT vs. Perceived Enjoyment:
Consumers are found to enjoy feeling the product before they buy, even if they do not purchase they will still feel more satisfied by touching the product. They can create a good judgment when they touch it and receive pleasure out of it. Many consumers need to come in contact just for fun, observation or enjoyment (Holbrook & Hirschman, 1982). Consumers often take shopping as fun escapade just for enjoyment and they need to feel things which are also a tradition before buying ((Holbrook & Hirschman, 1982).
Instrumental NFT vs. Perceived Ease of Use:
This allows the consumer to categorize product by its physical dimension. Consumers show high urge to come in contact with texture to collect bits of information about it. Such customers are quick to show response when making purchasing decision compared to those who cannot touch it because usage is made easier for their physic (PecK & Childers, 2003). Direct contact will create superior ease of use with assurance and lower frustration of not being able to touch (PecK & Childers, 2003)
Instrumental NFT vs. New Technology:
Previous research has shown perceived ease of use and perceived usefulness is motivator which allures the user to exercise this technology practice.
Instrumental NFT vs. Loyalty:
Few businesses have shown success in developing loyalty on e-commerce sites, and there is not enough research on involving loyalty with online customer’s (Srinivasan & Anderson, 2002). Lack of NFT has been absent for playing any major part in perusing e-loyalty. Positive and confident feedback is the foundation of preserving loyalty over the (Anderson & Fornell, 1994). Through loyalty online commerce can be said for sure the extent by which customers are in no doubt against one another (Anderson & Fornell, 1994).
New Technology vs. Perceived Ease of use:
Many researchers have discussed that new technology will bring people an effortless ease in their routine and daily procedures. They further uncovered how innovation would be better to create judgment; relieve pressure and be relatively better than traditional means of marketing (Tornatzky, 1982). Along with lowering usage complacency the technology should be useable effortlessly i.e. the whole point of innovation (Wolfinbarge & Gilly, 2003). Importance for PEOU cannot be stressed enough when conventional e-commerce lacks the sense of touch; new technology must keep in concern this lagging (Rust & Kannan)
New Technology vs. Perceived Enjoyment:
New technology while shopping online is an alluring feature which is quite enjoyable p. The new technology feature is intriguing them and one of a kind motivation the innovation has bought the customer for this incentive to enjoy technology. They have achieved their purpose of shopping with having had fun in the experience due to admiring the innovative feature’s artistic appeal p. Research has proven a customer’s elevated level of enjoyment while using something new and resulted in positive intentions appeal. The user will want to judge how much the innovation has worked out for them and helped them reach solutions or accomplish goals (Neslin & Scott, 2009).
Perceived Ease of Use vs. Loyalty:
PEOU is a well-established abridgment a determinant of service value (Dabholka, 1996) PEOU increases the reliability and competence of the service(M & Harker, 2002).For our e-commerce framework PEOU comes through practicality, convenience and optimism which is what the consumer looks for(Reibstein, 2002).
Perceived Ease of Use vs. Perceived Usefulness:
PU factor overwhelms PEOU because in many slow raising societies perception about a product’s usefulness is the only reason they may opt of online buying and then consider whether it there is ease in buying or not(Caruana, 2002).
Perceived Usefulness vs. Loyalty:
The extent by which a customer is treated as their complete perception; they will want to engage in another online shopping activity sooner or later, this is increasing loyalty and gaining trust in the whole online shopping system. PU serves a very prime factor when the consumer decides how the introduction of new technology will serve to their benefit (Davis, 1989). Further on, Loyalty is the importance of PU; has been proven positive in many studies (Ajzen & Fishbien, 1980).
Perceived Enjoyment vs. Loyalty:
Consumers overall conception contrast to actual experience is very important for consumer’s pleasure perceived Enjoyment is concerned when the user feels zero security threat, maximum convenience, satisfaction with the product itself and the technological experience or web layout; to move in the direction of loyalty (D & Hise, 2000). The traditional marketing world is revolutionizing towards e-commerce and the modern user is more technology friendly. This makes them more familiar with e-commerce for they can squeeze out enjoyment from their experience. The perception has changed their behavior and made them loyal when treated with superior online service. Besides, many studies have pre-proven strong relationship of customer loyalty and satisfied customers (Fornell, 1992).
Research Methodology
Method of data collection:
The paper is based upon retaining customers from Autotelic and Instrumental need for touch, as well as their perception in usage of e-commerce website to obtain loyalty. The source of data collection to aid this research was online and offline sources. Much of our audience could be tapped with ease as we collected data online. A questionnaire was made comprising of 25 questions; 4 questions for Autotelic NFT, Instrumental NFT, PU and PE, whereas 3 questions for PEOU, LOY and TEC. Questionnaire was sent through email to contacts, through Facebook messenger and WhatsApp. A larger audience was available to us by using theses social media websites, as well as our paper bases on e-commerce; we believe there was not any other better medium than using these sites. The main focus was to target a young audience because they have ample free time and show more enthusiasm with technology as well as the internet. Students were focal point in our data collection with the age group of 21-30 years (64.1% of all participants). A major portion of these had worked for 1-3 years and were from the following companies: Dex International, AP Logistics and Shah& Co. A small paragraph had been included in the questionnaire that explained purpose of this research alongside introduction of our Autotelic and instrumental need for touch.
Sampling:
The research’s sample size was 193 responses. A total of 250 questionnaires were sent out from which after filtration 193 were of use. Some of the respondents were unable to submit their responses on time and as a result were left out from being included in this paper. Another minute percent of respondents displayed downright lackadaisical attitude as they had answered our queries with much ignorance, such responses had to be removed to avoid deviating from our topic. 140 questionnaires were sent out to Dex International, AP Logistics and Shah & Co. These organizations had massive workers and majority of them skilled with basic internet knowledge. These workers had less than 5 years working experience (42.2%) within the age group below 30 years (64.1%). The audience was qualified enough to have basic understanding of our research matter and understoodits purpose. They had completed Masters (17.7%), Bachelors (45.3%), Intermediate (24.5%), Metric degree (8.9%) and Diploma certificate (2.1%). Larger proportion consists of females (66.7%) as compared with males (33.3%), as females are relatively more inclined toward online shopping.
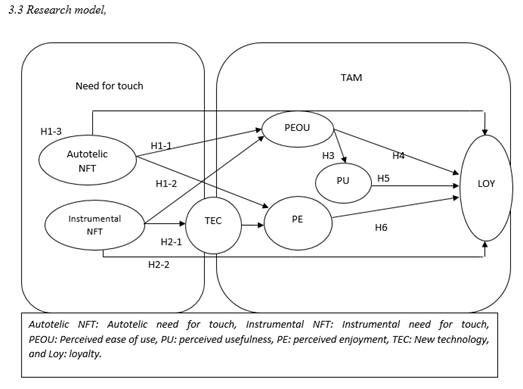
Figure no 1: Research model
Statistical technique:
Variable new technology TEC has been applied with mediation technique on Amos. For measurement model; construct reliability and Validity test was run to calculate CFA. IBM SPSS and Amos were used to run hypothesis test and model fitness. Google docs online forms were used to make questionnaires online and the result interpreted using Microsoft Excel and Word. Research articles and references were collected with the help of google scholar and Emerald insight.
Results & Analysis
Demographic statistics:
Table no 1: Gender
|
Gender |
Frequency |
Percent |
Total |
|
Male |
64 |
(33.3%) |
|
|
Female |
128 |
(66.7%) |
Females are at a higher percentage because we find that females are more interested to have online shopping experience. Moreover, females have more free time because they tend to stay indoors as compared to males.
Table no 2: Age group
|
Age Group |
Frequency |
Percent |
Total |
|
Below 20 years |
22 |
(11.5%) |
100 |
|
21 to 30 years |
123 |
(64.1%) |
|
|
31 to 40 years |
35 |
(18.2%) |
|
|
41 to 50 years |
7 |
(3.6%) |
|
|
51 and Above |
5 |
(2.6%) |
This research consists of people between the age bracket of 21-30 years, 31-40 years and below 20 years at the most. We conclude that this age bracket is more intact with ecommerce relatively.
Table no 3: Income level
|
Income Level |
Frequency |
Percent |
Total |
|
Below 15000 |
10 |
(5.2%) |
100 |
|
16,000 - 20,000 |
69 |
(35.9%) |
|
|
21,000 - 30,000 |
28 |
(14.6%) |
|
|
31,000 – 40,000 |
35 |
(18.2%) |
|
|
Other |
51 |
(26.6%) |
Income level is the most recorded percentage in
our research of 16000-2000 and 26.6% of respondents were
uncomfortable in sharing their income levels with us.
Table no 4: Qualification
|
Qualification |
Frequency |
Percent |
Total |
|
Metric |
17 |
(8.9%) |
100 |
|
Intermediate |
47 |
(24.5%) |
|
|
Bachelors |
87 |
(45.3%) |
|
|
Masters |
34 |
(17.7%) |
|
|
Diploma certificate |
4 |
(2.1%) |
|
|
Other |
6 |
(3.1%) |
24.5% of our respondents are intermediate qualified and the most of our respondents are bachelor students (45.3%).
Table no 5: Work experience
|
Work experience |
Frequency |
Percent |
Total |
|
Less than 1 year |
67 |
(34.9%) |
100 |
|
1-3 years |
81 |
(42.2%) |
|
|
4-6 years |
22 |
(11.5%) |
|
|
7-10 years |
13 |
(6.8%) |
|
|
Above 10 years |
12 |
(6.3%) |
Most of the respondents are employees of Dex international, AP Logistics and Shah & Co. They have been working for almost 3 years and have a sufficient grip in ecommerce and general know how about technology.
Table no 6: CFA
|
Construct/Indicators
|
Standardized Factor Loading (CFA-AMOS) |
Construct Reliably |
Construct Validity |
|
||||||
|
Cronbach’s alpha |
Composite Reliability (CR) |
Convergent Validity |
Discriminant Validity |
|||||||
|
Average Variance Extracted (AVE) |
Maximum Shared Variance (MSV) |
Average Shared Variance (ASV) |
||||||||
|
Need for Touch – Autotelic |
0.816 |
0.817 |
0.529 |
0.0841/0.0324/0.0121/ 0.0729/0.0484/0.1024 0.0841 |
0.0587 |
|||||
|
Need for Touch – Autotelic 1 |
0.73 |
|||||||||
|
Need for Touch – Autotelic 2 |
0.69 |
|||||||||
|
Need for Touch – Autotelic 3 |
0.67 |
|||||||||
|
Need for Touch – Autotelic 4 |
0.81 |
|||||||||
|
Need for Touch – Instrumental |
0.757 |
0.809 |
0.516 |
0.0841/0.0729/0.0361 0.0676/0.0225/0.0576 0.0841 |
0.0568 |
|||||
|
Need for Touch – Instrumental 1 |
0.75 |
|||||||||
|
Need for Touch – Instrumental 2 |
0.80 |
|||||||||
|
Need for Touch – Instrumental 3 |
0.69 |
|||||||||
|
Need for Touch – Instrumental 4 |
0.62 |
|||||||||
|
Perceived Ease of Use |
0.834 |
0.837 |
0.632 |
0.0729/0.0324/0.0289 0.0196/0.01/0.0169 0.0729 |
0.030116 |
|||||
|
Perceived Ease of Use 1 |
0.76 |
|||||||||
|
Perceived Ease of Use 2 |
0.75 |
|||||||||
|
Perceived Ease of Use 3 |
0.87 |
|||||||||
|
Perceived Usefulness |
0.912 |
0.913 |
0.723 |
0.028/0.0361/0.0121 0.0576/0.0576/0.1225 0.1225
|
0.0524 |
|||||
|
Perceived Usefulness 1 |
0.87 |
|||||||||
|
Perceived Usefulness 2 |
0.88 |
|||||||||
|
Perceived Usefulness 3 |
0.81 |
|||||||||
|
Perceived Usefulness 4 |
0.84 |
|||||||||
|
Perceived Ease |
0.932 |
0.932 |
0.775 |
0.0576/0.0196/0.0676 0.0729/0.1764/0.49 0.49 |
0.14735 |
|||||
|
Perceived Ease 1 |
0.89 |
|||||||||
|
Perceived Ease 2 |
0.89 |
|||||||||
|
Perceived Ease 3 |
0.88 |
|||||||||
|
Perceived Ease 4 |
0.86 |
|||||||||
|
Loyalty |
0.799 |
0.805 |
0.579 |
0.1764/0.0576/0.01 0.0225/0.0484/0.5184 0.5184 |
0.11242 |
|||||
|
Loyalty 1 |
0.71 |
|||||||||
|
Loyalty 2 |
0.81 |
|||||||||
|
Loyalty 3 |
0.76 |
|||||||||
|
Technology |
0.806 |
0.814 |
0.596 |
0.5184/0.49/0.1225 0.0169/0.057/0.1024 0.5184 |
0.21786 |
|||||
|
Technology 1 |
0.64 |
|||||||||
|
Technology 2 |
0.81 |
|||||||||
|
Technology 3 |
0.85 |
|||||||||
|
Reliability and Construct Validity Thresholds: [Suggested by Fornell and Larcker (1981)] |
α > 0.70 (Nunnaly, 1967) |
CR > 0.70 |
i) AVE > 0.50 ii) CR > AVE |
MSV < AVE |
ASV < AVE |
|||||
Where λ=Standardized
Factor Loading; n=number of items;δ= error
variance = (1- multiple correlation
coefficient) =
|
|
|||||||||
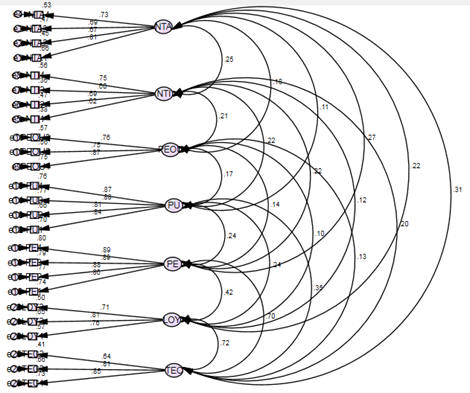
Figure no 2: Model fit
To test the model’s fitness, seven indices are available. Namely: Chi-square, P. value, adjusted goodness of fit index, comparative fit index, tucker Lewis index, goodness fit index and root mean square error of approximation. The acceptance model values recorded are as mentioned below, all values clearly met their criteria respectively.
Table no 7: Model Fitness
|
Chi- square/df |
P-Value |
GFI |
AGFI |
CFI |
TLI |
RMSEA |
|
1.177 |
0.003 |
0.887 |
0.861 |
0.981 |
0.978 |
0.031 |
(All values meet their benchmark; model is deemed fit). Chi-square recorded 1.1773 and criteria: <3, P-value recorded 0.003 and criteria >0.00, GFI recorded 0.887 and criteria: >0.90-0.8, AGFI recorded 0.861 and criteria: >0.90-0.8, CFI recorded 0.981 and criteria: >0.90, TLI recorded 0.978 and criteria: >0.90, RMSEA recorded 0.031 and criteria: <0.08.
Hypothesis test using mediation analysis:
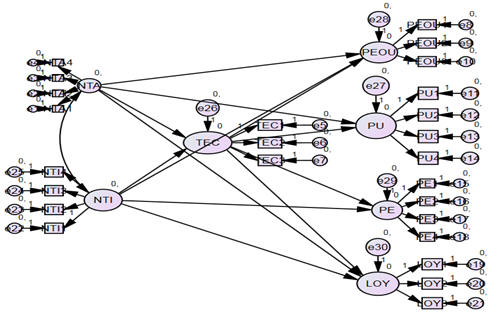
Figure no 3: Hypothesis test using mediation analysis
Table no 8: Two tailed test: indirect effect
|
|
NTA |
NTI |
|
TEC |
|
|
|
LOY |
0.006 |
0.269 |
|
PE |
0.008 |
0.271 |
|
PU |
0.006 |
0.218 |
|
PEOU |
0.307 |
0.338 |
|
NTA |
NTI |
|
|
TEC HA |
TEC HA |
|
|
LOY HA below 0.05 = accept |
LOY HA above 0.05 = reject |
|
|
PE HA below 0.05= accept |
PE HA above 0.05= reject |
|
|
PU HA below 0.05 = accept |
PU HA above 0.05 = reject PEOU HA below 0.05 = reject |
|
|
PEOU HA above 0.05 = reject |
||
Our overall analysis of indirect effect of NTA and NTI comprise of the impacts these variables had on each other. A detailed explanation is as follows in the following paragraph; the impact on Need for Touch Autotelic of Technology HA has no effect, Loyalty HA is accepted as it is 0.006 whereas the criteria is 0.05; there is no indirect effect of this variable. Perceived Ease HA is accepted as it is 0.008< 0.05, there is indirect effect on Need for Touch Instrumental. Perceived Use HA is accepted as it is 0.006 < 0.05 and Perceived Ease of Use HA is rejected as it is 0.307. The criteria are the values to above 0.05. Whereas for Need for Touch Instrumental; Loyalty HA is rejected because its value is 0.269, Perceived Ease HA is rejected as its value is 0.271, Perceived use HA is rejected for its value is 0.218 and Perceived Ease of use HA is rejected for its value is 0.338.
Table no 9: Two tailed test: direct effect
|
|
NTA |
NTI |
TEC |
|
TEC |
0.008 |
0.282 |
*** |
|
LOY |
0.992 |
0.744 |
0.002 |
|
PE |
*** |
0.135 |
0.003 |
|
PU |
0.996 |
*** |
0.003 |
|
PEOU |
0.346 |
0.144 |
0.540 |
|
NTA |
NTI |
TEC |
|
TEC HA below 0.05 = reject |
TEC HA above 0.05 = accept |
TEC HA below 0.05 |
|
LOY Ha above 0.05 = accept |
LOY HA above 0.05 = accept |
LOY HA below 0.05 = reject |
|
PE Ha below 0.05 |
PE HA above 0.05 = accept |
PE HA below 0.05 = reject |
|
PU Ha above 0.05 = accept |
PU HA below 0.05 |
PU HA below 0.05 = reject |
|
PEOU Ha above 0.05 = accept |
PEOU HA above 0.05 = accept |
PEOU HA above 0.05 = accept |
The impact of Need for Touch Autotelic on Technology HA is rejected for its value is 0.008, Loyalty HA is accepted as its value is 0.006, Perceived Ease HA has no effect, Perceived Use HA is accepted for it is 0.996 and Perceived Ease of Use is accepted for its value is 0.346. The impact of Need for Touch Instrumental on Technology HA is accepted for its value 0.282, Loyalty HA is accepted for its value 0.744, Perceived ease HA is accepted for its value 0.135, Perceived usefulness HA has no effect, Perceived Ease of Use HA is accepted for it is 0.144. The impact on Technology on Technology is none, Loyalty HA is rejected for its value 0.002, Perceived ease HA is rejected for its value 0.003, Perceived Usefulness Ha is rejected for its value 0.003 and Perceived Ease of use is accepted for its value is 0.540.
Conclusion and Discussions
The research was conducted to test the mediation effect new technology will have on loyalty in the online commerce community. Previous researches have been based to analyze mediation effects of PEOU, PU and PE towards Loyalty, whereas the addition of new technology model will bring higher perceived ease to the user. -The effect of new technology was found positive because ease in the usage for ecommerce fulfils instrumental Need for touch of user and brings their desired product even closer near reality to them.
Limitation and Recommendations
Some hurdles were faced during the tenure of compiling this research. Namely the time factor, if allotted more time there could have been collected a larger sample size. Many responses came delayed after the data compilation had already begun, had they arrived within time; relatively larger sample size would have been incorporated. Numerous responses i.e. questionnaires were filled with lack of enthusiasm and lacked interest, they too had to be removed from being a part of this research. Additional time may have significantly improved sample size and results. There could have been augmented research of how new technology may be applied and what technological equipment or software may have been used to aid perceived ease. May it be augmented/virtual reality or haptics to establish a higher link between them.
BIBLIOGRAPHY Adelaar, T. (2004). Enhancing customer value through click and-mortar e-commerce: implications for geographical market reach and customer type. Telematics and Informatics, 21(2), 167-182.
Ajzen, I., & Fishbien, M. (1980). understanding attitudes and tools predicting social behavior , 530-545.
Anderson, E. W., & Fornell, C. (1994). Customer satisfaction, market share and profitability findings from Sweden. Journal of Marketing, 20(2), 53-66.
Bell. (2015). "How to win in an omnichannel world. MIT Sloan Management Review, 56(1), 45-53.
Caruana, A. (2002). Service loyalty: the effects of service quality and the mediating role of customer satisfaction. European Journal of Marketing, 36, 811-29.
D. S., & Hise, R. (2000). E staisfaction: An initail examination. Journal of retaing, 309-322.
Dabholka, P. A. (1996). Consumer evaluations of newtechnology-based self-service options: an investigation of alternative models. International Journal of Research in Marketing, 13(1), 29-51.
Davis, F. D. (1989). Perceived usefulness, perceived ease of use nd user acceptance of information technolog. MIS Quarterly, 19(3), 319-40
DeNale, R. (2016). “Quarterly retail e-commerce sales 2nd quarter.
Drew, S. (2003). Strategic Uses of E-Commerce by SMEs in the East of England. European Management Journal, 21, 79-88.
Enright, A. (2015). U.S. annual e-retail sales surpass $300 billion for the first time. Internet Retailer Magazine(29).
Fornell. (1992). The Impact of Customer Perceptions and Satisfaction on E-Loyalty), 6—21.
Geffin, & Straub. (2000). Comfort your online customer: quality, trust, and loyalty on the internet.
Hamid, A. A., Abdul razzak, F. Z., A. A., & Adbullah, W. W. (n.d.). The Effects of Perceived Usefulness and Perceived Ease of Use on Continuance Intention to Use E-Government.
Hansen. (2015). Hummel's digital transformation toward omnichannel retailing: Key lessons learned. MIS Quarterly Executive, 14(2), 51-66.
Hertzog, C., & HultscH, D. F. (2000). Metacognition in Adulthood and Old Age. Lawrence Erlbaum Associates, New Jersey.
Holbrook, M., & Hirschman, E. C. (1982). The experiential aspects of consumption Consumer fantasies, feelings, and fun. Journal of Consumer Research,, 9, 132-140.
Jianjun, Z., David, K. T., & Qiang, F. (2017). Effects of online consumer reviews on firm-based and expert-based communications. Journal of Research in Interactive Marketing, 12(1), 1.
Juaneda, A., Emma, Ana , M., & Yolanda, S. M. (2016). "Omnichannel Customer Behavior: Key Drivers of Technology Acceptance and Use and Their Effects on Purchase Intention (Vol. 7).
Klatzky, R. L., Lederman, s. j., & Matula, D. E. (1993). Haptic exploration in the presence of vision. Journal of Experimental Psychology, 19(4), 726-743.
M, X., & Harker, P. T. (2002). Customer efficiency: concept and its impact on e-business managemen. Journal of Service Research, 4, 253-67.
McDougall, G. H., & Levesque, T. (2000). Customer satisfaction with service: putting perceived value into the equation. Journal of Services Marketing, 42(9), 1084-1094.
Neslin, & Scott, A. (2009). Key issues in multichannel customer management: Current knowledge and future directions. Journal of Interactive Marketing, 23(1), 70-81.
P. ,. (2003a). To have and to hold: The influence of haptic information on product judgments. Journal of Marketing, 67(2), 35-48.
Papadopoulou, P., & Andreou, A. (2001). Trust and relationship building in electronic commerce. Internet Research: Electronic Networking and POLICY, 11(4), 322-32.
Parasuraman, ,. A., Zeithaml, V. A., & Berry, L. L. (n.d.). A conceptual model of service quality And its implication. JOURNAL OF MARKETING .
Payne, J., JR, B., & Jhonsan, E. (1993). The adaptive decision maker. UK: Cambridge university press.
PecK, J., & Childers, T. (2003). To have and to hold: the influence of haptic information on product Judgments. Journal of Marketing, 67, 35-48.
Peck, J., & Childers, T. L. (2003). To have and to hold: The influence of haptic information on product judgments. Journal of Marketing, 67, 36–45.
Peck, J., & SHU, s. (2009). The effect of mere touch on perceived ownership. Journal of Consumer Research(36), 434-447.
Peck, J., & WigginS, J. (2006). It just feels good: Consumers’ affective response to touch and its influence on persuasion. Journal of Marketing,(70), 56–69.
Pfeffer, J. (1982). Organizations and Organizations Theory. Pitman, Boston.
Radner, R., & Rothschild, M. (1975). On the Allocation of Effort. Journal of Economic Theory, 10, 358-376.
Rangaswamy. (2005). "Opportunities and challenges in multichannel marketing: An introduction to the special issue. Journal of Interactive Marketing, 19(2), 5-11.
Reibstein, D. J. (2002). What attracts customers to online stores and what keeps them coming back. Journal of the Academy of Marketing Science, 30(4), 465-73.
Reichheld, F., Sasser, W., & EARL, J. R. (1990). Zero defections: quality comes to services. Harvard Business Review, 68(5), 105-111.
Rust, R. T., & Kannan, P. K. (n.d.). The era of e-service”, in Kannan, P.K. (Ed. e-Service. New Directions in Theory and Practice.
Srinivasan, S. S., & Anderson, R. E. (2002). Customer loyalty in e-commerce: an exploration of itsantecedents and consequences. Journal of Retailing, 78(1), 41-51.
Stoica, E., & Brote, V. L. (2012). New technology shaping the e-commerce environment. Marketing commerce and tourism and a new paradigm of change.
Time, t. (2015). Study: 85% of consumers prefer to shop at physical stores vs. online.
Tornatzky, L. G. (1982). lnnovation Characteristics and nnovation Adoption-lmplemetation. IEEE Transactions on Engineering Management , 28-45.
Tuten, T. L. (n.d.). Customer engagement behavior: theoretical foundations and research directions. Journal of Service Research, 13.
Wolfinbarge, m., & Gilly, m. c. (2003). EtailQ:dimensionalizing, measuring and predicting etail qualit. Journal of Retailing, 79(3), 183-93.
Yazdabnparast. (n.d.).
Yazdanparast, Spears, A., & N. (2013). Can consumers forgo the need to touch products? an investigation of nonhaptic situational factors in an online context. Psychology & Marketing, 30(1), 46-61.